
Northeastern Wisconsin
Non-Point Pollution Sources

Map of the Northeastern Lakeshore TMDL area. From Wisconsin Department of Natural Resources’ Northeast Lakeshore TMDL March 2021 Informational Webinar.
To develop a Total Maximum Daily Load (TMDL) the Wisconsin Department of Natural Resources is conducting studies examining surface water quality impairments throughout several watersheds in Northeastern Wisconsin (see map on left). Agriculture makes up 60% of land use in this area. Unfortunately, agriculture, while not the only source of non-point pollution in Northeastern Wisconsin, is the largest source.
Preliminary data shows that in the Between the Lakes Demonstration Farm Network watersheds total phosphorus and total suspended solids are a large part of the non-point source pollution entering Lake Michigan.
As these charts below show, agriculture is a large contributor of phosphorus and total suspended solids entering Lake Michigan from the Manitowoc and Sheboygan watersheds. Therefore the Between the Lakes Demonstration Farm Network and its farmers are working hard to improve soil health which will result in cleaner water.
Further details about non-point sources of pollution in the Manitowoc and Sheboygan River Watersheds can be found on the Wisconsin Department of Natural Resources’ Northeast Lakeshore TMDL website.
To develop a Total Maximum Daily Load (TMDL) the Wisconsin Department of Natural Resources is conducting studies examining surface water quality impairments throughout several watersheds in Northeastern Wisconsin (see map above). Agriculture makes up 60% of land use in this area. Unfortunately, agriculture, while not the only source of non-point pollution in Northeastern Wisconsin, is the largest source.
Preliminary data shows that in the Between the Lakes Demonstration Farm Network watersheds total phosphorus and total suspended solids are a large part of the non-point source pollution entering Lake Michigan.
As these charts below show, agriculture is a large contributor of phosphorus and total suspended solids entering Lake Michigan from the Manitowoc and Sheboygan watersheds. Therefore the Between the Lakes Demonstration Farm Network and its farmers are working hard to improve soil health which will result in cleaner water.
Further details about non-point sources of pollution in the Manitowoc and Sheboygan River Watersheds can be found on the Wisconsin Department of Natural Resources’ Northeast Lakeshore TMDL website.
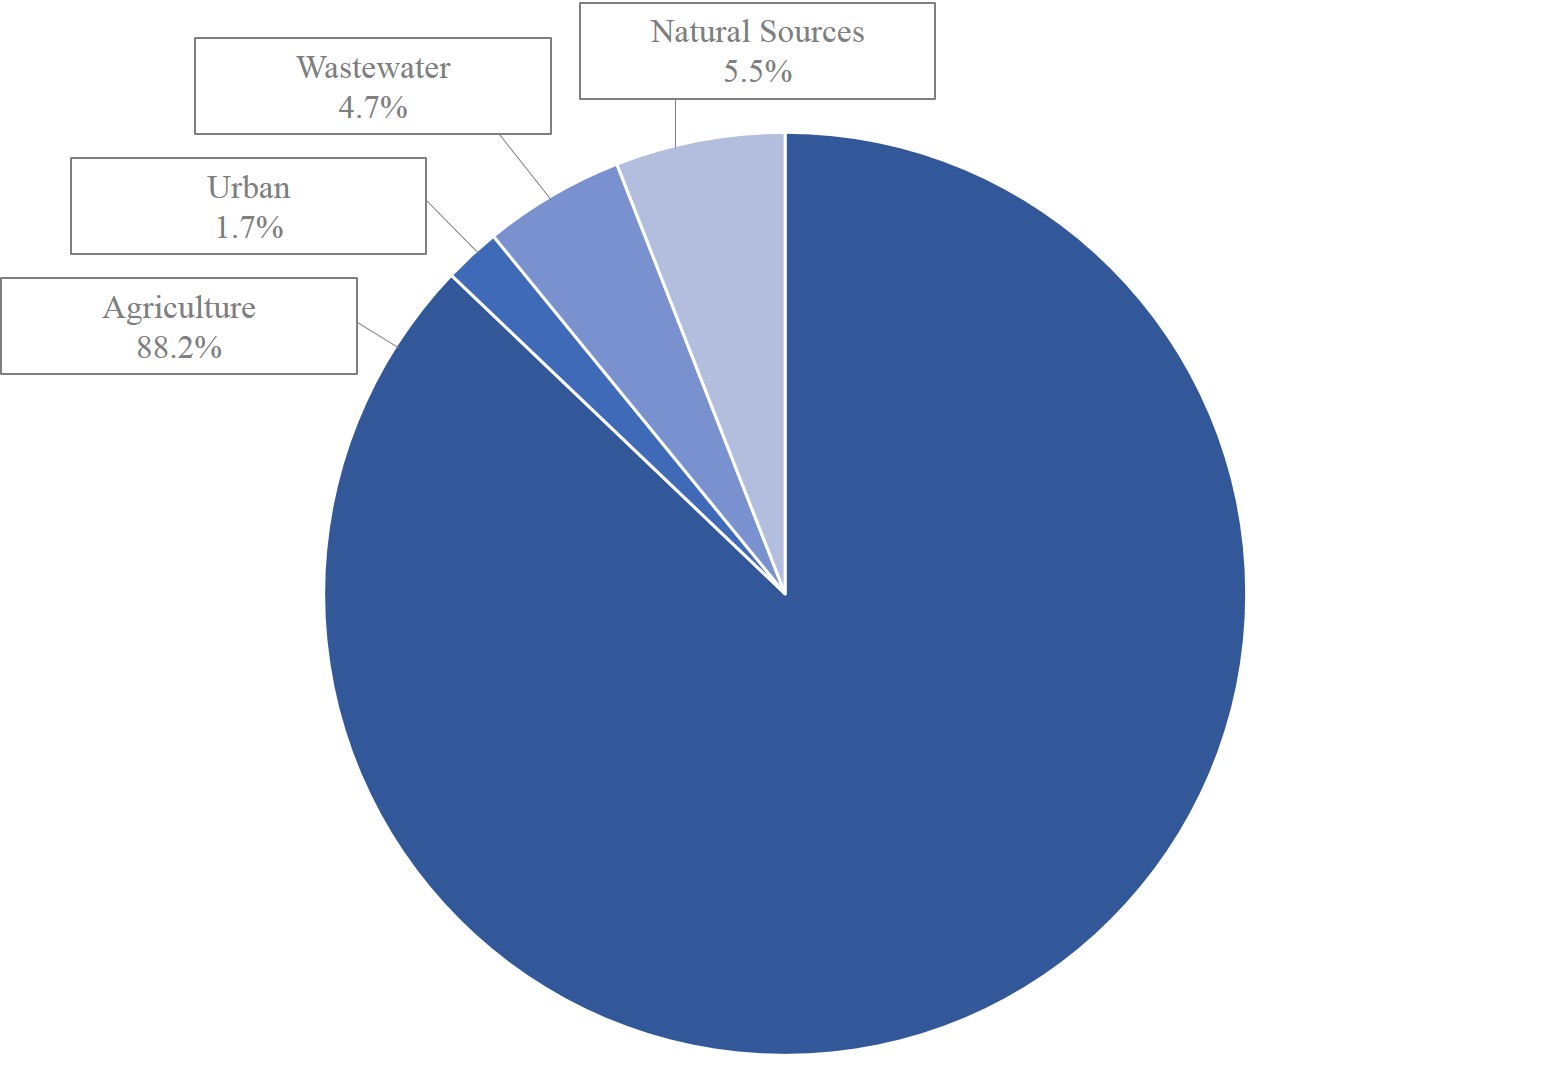
Total Phosphorus
This chart illustrates the total phosphorus loading by source in the Manitowoc and Sheboygan watersheds combined.
Approximately 385,000 lbs/year of phosphorus is entering Lake Michigan from the Manitowoc and Sheboygan watersheds combined. Of that, 88.2% is from agriculture, while 1.7% is from urban, 4.7% is from wastewater, and 5.5% is from natural sources.
This data was provided, in its draft form, by Wisconsin Department of Natural Resources’ Kim Oldenborg, based on the draft watershed model which will be used to develop the final Northeast Lakeshore TMDL.
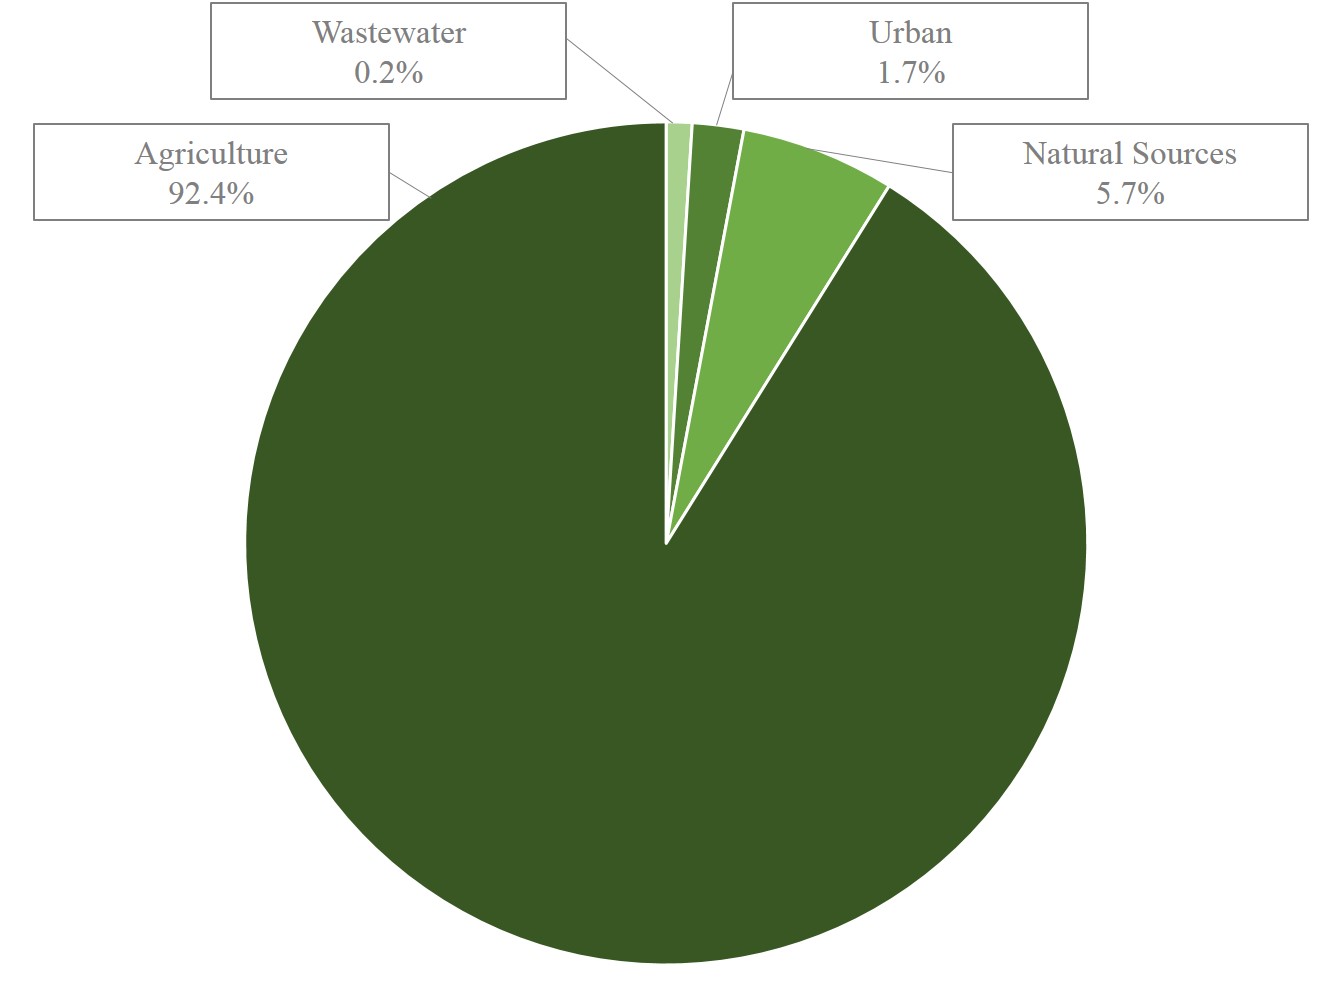
Total Suspended Solids
This chart illustrates the total suspended solids loading by source in the Manitowoc and Sheboygan watersheds combined.
Approximately 52.4 million lbs/year of suspended solids is entering Lake Michigan from the Manitowoc and Sheboygan watersheds combined. Of that, 92.4% is from agriculture, while 1.7% is from urban, 0.2% is from wastewater, and 5.7% is from natural sources.
This data was provided, in its draft form, by Wisconsin Department of Natural Resources’ Kim Oldenborg, based on the draft watershed model which will be used to develop the final Northeast Lakeshore TMDL.